There was a recent blog post asking whether the debug framework had any unit tests and if so, where we were hiding them. Yes we do have a test suite to help protect against regressions and we hide it in the org.eclipse.jdt.debug.tests plug-in.
The majority of the tests require some implementation of the debug framework to run. We are responsible for the JDT Debugger, which is part of the SDK and implements the majority of the standard debug model. So the tests were designed to use JDT.
Until Dave brought the idea up, I had never thought of anyone using unit tests to help implement their own debugger. The current tests certainly are not set up for this style of development. I think it would be really cool to have a generic testing harness that checks the behaviour of the framework. Users could have the test harness run against their implementations of the debug interfaces/extensions. Perhaps Bug 259145 could evolve into something like that.
Thursday, December 18, 2008
Thursday, December 04, 2008
Delivering Feature Patches - Part II
This post will go over the basics of creating a Feature Patch, the most robust option when wanting to deliver some code changes, as discussed in my previous post.
First we must grab the bundles we are changing and edit the code. For this example I grabbed the org.eclipse.debug.ui bundle from CVS and applied the latest patch for the new Debug Breadcrumbs feature Pawel is working on.
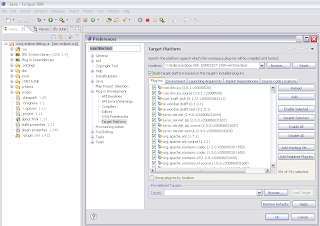
You must also set up your target platform (Window > Preferences > PDE > Target Platform) to be what your intended client is using. Your target platform will determine what feature version you are going to patch. Therefore, to create a patch against 3.4.1, make sure to set your target platform to a 3.4.1 install. In this example I am using my default target platform (the latest I build).
Note that at this point, we could use PDE to launch a runtime workbench and test out the changes immediately.
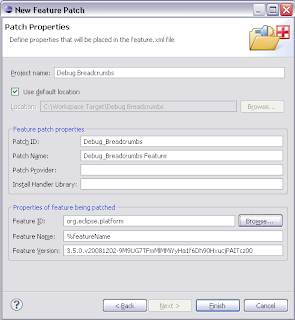
Now to create the feature patch, use File > New > PDE > Feature Patch. This brings up a wizard with multiple dialogs to fill in.
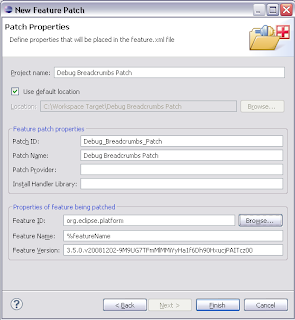
You will have to choose a project name which is the name of the project that will be created in your workspace. Then you must choose a patch ID and name, which will be what your user sees when they try and install the patch. Finally, you must choose the feature which you are patching. Hitting the browse button will allow you to select one of the features from your target platform, and the name and version will be filled in for you.
Hitting finish will bring up the feaure patch editor where you can edit many more things. For the simple case, we are going to move directly to the Plug-ins tab of the editor. Here, we will specify what new bundles the feature will have. Hit the Add... button and select your workspace bundle. You don't have to specify a version for the bundle because by default we will set the proper versions when we export.
 The next step is to export the patch. PDE provides a convenient button in the top right section of the editor which will open the export dialog. Choose a directory where you want to export (you can move this folder to a website later to make it available remotely). You can also export to a jar file.
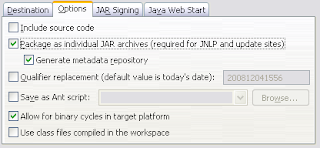
 On this wizard it is also very important to go to the options tab and turn on the "package as individual jar archives" and "generate metadata" options. These options are required for p2 to be able to understand and install the patch.
Hit the finish button, wait for the operation to complete and we're done!
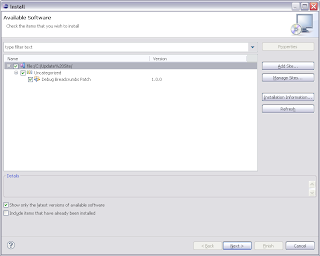
To install the patch, we go to Help > Install New Software... Hit the Add Site button and select the directory we exported to (or the remote location, or the jar file). The dialog should now show our patch, check it and hit next to begin the install. You will have to step through a few pages to accept the license agreement.
After the install completes, we are prompted to restart eclipse (highly recommended). When Eclipse returns, we have a brand new feature to play around with.
So there you go, the basics of creating a feature patch!
Optional: Instead of exporting the patch directly, you can also use an update site project with a site.xml to deliver the patch. Simply open an existing site.xml or create a new site project (File > New... > PDE > Update Site Project), hit the add button, select your feature patch project, and build the site. Using a update site project will generate an html page as well as allow the pre-p2 update manager to access the site.
First we must grab the bundles we are changing and edit the code. For this example I grabbed the org.eclipse.debug.ui bundle from CVS and applied the latest patch for the new Debug Breadcrumbs feature Pawel is working on.
You must also set up your target platform (Window > Preferences > PDE > Target Platform) to be what your intended client is using. Your target platform will determine what feature version you are going to patch. Therefore, to create a patch against 3.4.1, make sure to set your target platform to a 3.4.1 install. In this example I am using my default target platform (the latest I build).
Note that at this point, we could use PDE to launch a runtime workbench and test out the changes immediately.

Now to create the feature patch, use File > New > PDE > Feature Patch. This brings up a wizard with multiple dialogs to fill in.

You will have to choose a project name which is the name of the project that will be created in your workspace. Then you must choose a patch ID and name, which will be what your user sees when they try and install the patch. Finally, you must choose the feature which you are patching. Hitting the browse button will allow you to select one of the features from your target platform, and the name and version will be filled in for you.
Hitting finish will bring up the feaure patch editor where you can edit many more things. For the simple case, we are going to move directly to the Plug-ins tab of the editor. Here, we will specify what new bundles the feature will have. Hit the Add... button and select your workspace bundle. You don't have to specify a version for the bundle because by default we will set the proper versions when we export.
 The next step is to export the patch. PDE provides a convenient button in the top right section of the editor which will open the export dialog. Choose a directory where you want to export (you can move this folder to a website later to make it available remotely). You can also export to a jar file.
 On this wizard it is also very important to go to the options tab and turn on the "package as individual jar archives" and "generate metadata" options. These options are required for p2 to be able to understand and install the patch.
Hit the finish button, wait for the operation to complete and we're done!
To install the patch, we go to Help > Install New Software... Hit the Add Site button and select the directory we exported to (or the remote location, or the jar file). The dialog should now show our patch, check it and hit next to begin the install. You will have to step through a few pages to accept the license agreement.

After the install completes, we are prompted to restart eclipse (highly recommended). When Eclipse returns, we have a brand new feature to play around with.

So there you go, the basics of creating a feature patch!
Optional: Instead of exporting the patch directly, you can also use an update site project with a site.xml to deliver the patch. Simply open an existing site.xml or create a new site project (File > New... > PDE > Update Site Project), hit the add button, select your feature patch project, and build the site. Using a update site project will generate an html page as well as allow the pre-p2 update manager to access the site.
Delivering Feature Patches
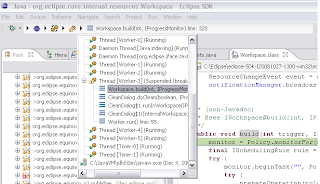
One of the debug committers, Pawel Piech, has been working on creating a debug context breadcrumb. A cool feature that we are all looking forward too. The current patch applies nicely to the debug ui project, but there is a need to try out the feature in your main Eclipse environment. Self-hosting isn't practical for everyone. There are a couple of ways of doing this in 3.5:
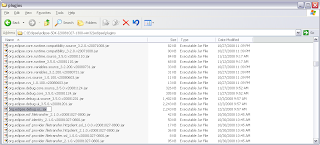
1) Hack them in :) Export the bundles, put them in your install directory, rename them to have the same name and version as the previously installed bundles and start with -clean. This will trick p2 into loading the new code and treating it the same as the previous bundles. This is not a great choice as you are working behind p2's back so if there are any problems, you are on your own.
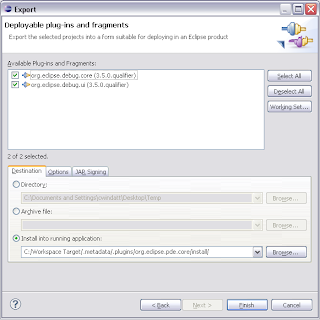
2) Use the new PDE one step export and install feature. Simply go to File > Export... > PDE > Deployable Plug-ins and Fragments. Then in the wizard, choose the last radio button "Install into running application". This will build your workspace bundles and use p2 to install them into your host application. Assuming all goes well, you'll have your code up and running and you can uninstall the changes using p2's UI (Help > Installation Information).
3) Create a feature patch. While option 2 is the fastest for developers, feature patches allow you to provide the changes via an update site. Users will be able to install without ever checking out any code from CVS. My next blog post will explain the basics of creating a feature patch.
1) Hack them in :) Export the bundles, put them in your install directory, rename them to have the same name and version as the previously installed bundles and start with -clean. This will trick p2 into loading the new code and treating it the same as the previous bundles. This is not a great choice as you are working behind p2's back so if there are any problems, you are on your own.

2) Use the new PDE one step export and install feature. Simply go to File > Export... > PDE > Deployable Plug-ins and Fragments. Then in the wizard, choose the last radio button "Install into running application". This will build your workspace bundles and use p2 to install them into your host application. Assuming all goes well, you'll have your code up and running and you can uninstall the changes using p2's UI (Help > Installation Information).

3) Create a feature patch. While option 2 is the fastest for developers, feature patches allow you to provide the changes via an update site. Users will be able to install without ever checking out any code from CVS. My next blog post will explain the basics of creating a feature patch.

Wednesday, September 24, 2008
The Debug Team Family Grows
As of 5:05 this morning, the Debug Team's family grew by one.
Congratulations Mike and Jen on your new baby boy!
Sean Robert Rennie
8.5 pounds, 21 inches
Congratulations Mike and Jen on your new baby boy!
Sean Robert Rennie
8.5 pounds, 21 inches
Thursday, July 10, 2008
Remember, hyperlink debugging rocks
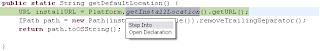
While the feature has been around since 3.3, I still consider hyperlink debugging one of the most awesome features of the JDT debugger.
Hyperlink debugging lets you very quickly step into a selected method. Previously, to step into a method you would have to use step over to the line you wanted then step into, or click on the method you wanted and hit step into selection. With hyperlink debugging you simply hit ctrl (or ctrl-alt, I'll explain in a moment), and click where you want to go.
Starting with next week's integration build, the hyperlink debug feature will use ctrl as it's activator (previous versions used ctrl-alt). This change was made because we were the only hyperlink action to have an activator other than ctrl. If there are multiple hyperlink actions available, a handy popup will let you choose which to use.
For those who want to keep the old way of doing things, you can change the setting back to ctrl-alt on the General > Appearence > Editors > Text Editors >Hyperlinking Preference Page. Because I am often debugging a target platform, I often need quick access to both open type and step into selection hyperlinks, so I have switched my preference. If you think that ctrl-alt should be the default, leave a comment here.
Hyperlink debugging lets you very quickly step into a selected method. Previously, to step into a method you would have to use step over to the line you wanted then step into, or click on the method you wanted and hit step into selection. With hyperlink debugging you simply hit ctrl (or ctrl-alt, I'll explain in a moment), and click where you want to go.

Starting with next week's integration build, the hyperlink debug feature will use ctrl as it's activator (previous versions used ctrl-alt). This change was made because we were the only hyperlink action to have an activator other than ctrl. If there are multiple hyperlink actions available, a handy popup will let you choose which to use.
For those who want to keep the old way of doing things, you can change the setting back to ctrl-alt on the General > Appearence > Editors > Text Editors >Hyperlinking Preference Page. Because I am often debugging a target platform, I often need quick access to both open type and step into selection hyperlinks, so I have switched my preference. If you think that ctrl-alt should be the default, leave a comment here.
Wednesday, April 16, 2008
Funny Error Dialogs
I was working today when this gem showed up:

While wondering how much money the person that created this dialog got for using the word 'update' so many times, I clicked 'ok' and got this gem:

Its always funny to see posts about weird / bad dialogs (and messages) so I thought I would share these...

While wondering how much money the person that created this dialog got for using the word 'update' so many times, I clicked 'ok' and got this gem:

Its always funny to see posts about weird / bad dialogs (and messages) so I thought I would share these...
Monday, March 17, 2008
Another Succesful Tutorial
I've only been in Santa Clara for 24 hours or so, but I've already done so much and had a ton of fun.
First off, I had some time to bask in the sun. Compare...

The view from my balcony at home (at least there isn't much snow, unlike Ottawa)

The view from my hotel room in Santa Clara (oooh palm trees)
Second, I've met a ton of people who I interact with all the time on bug reports, but had never seen in person. Hopefully I left a good impression. Had a lot of fun at the blogger party as well.

Finally, I helped present the two debug tutorials this morning and everything went perfectly. We covered a lot of material, and got some excellent questions. If you are building a debugger using our framework, make sure to let us know about it! We had several people come up and tell us how much they liked our presentation and how great their products are developing because of the debug framework, but it would be great to see them in action.
Tomorrow brings many more possibilities, with many talks, exciting BoFs, and some exercise.
Curtis
Wednesday, February 06, 2008
Api Tools is Official
With much joy, I am happy to say that the Api Tools incubator project is now part of the SDK proper. We (Darin, Olivier and myself) have been working very hard to get it up and running (and useful).
The project has come a long way since my last post....
We now have:
1. an incremental builder
2. problem markers for api usage problems / api breaking changes

3. filters for api problem kinds

4. quick-fixes for a variety of api problem kinds


5. a wizard to set up api tooling on plugin projects

6. preference / property pages to configure options for the tooling

7. version management

8. @since tag management

Stay tuned for more updates...
Monday, January 21, 2008
Creating help just got a little bit easier
Are you looking forward to the 3.4 doc pass? No? Really now, where is your user assistance spirit?
In 3.4 PDE is hoping to improve your documenting days, specifically by making it easier to create, edit and review context sensitive help. The first step was to create a fancy new editor...
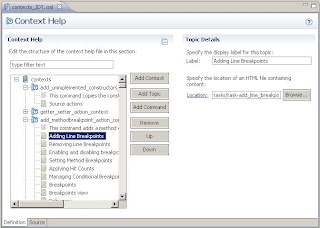
The editor allows you to quickly create and edit new new contexts, topics and commands. But the addition of dragging and dropping, cutting and pasting, opening linked files in various views, and more, is what makes this editor so much better then trudging through the xml. The editor should be the default editor for context help xml starting with today's I build.
There's more to come as well. During 3.4 PDE will hopefully be adding more features to help connect the context ids in your code with those in the xml.
A big thanks goes out to Chris and the PDE team, who managed to review and commit my 5000+ line patch in record time.
Subscribe to:
Posts (Atom)