Wednesday, September 16, 2009

API Use Reports

It's no longer rocket science - mere mortals can create API Use Reports using Eclipse 3.6 M2. Report generation is integrated as an external tool. Simply open the External Tools dialog (Run > External Tools > External Tools Configurations...), create a new "API Use Report" configuration, tweak settings, and press "Run".


You have to specify:
  • The bundles to analyze (which can be provided as an API baseline, a PDE target definition, or simply as a directory)
  • Whether to report API and/or internal references
  • Optionally, the scope to analyze (use regular expressions to include bundles to search and bundles you are interested in references to, or leave blank to scan everything)
  • A directory to write the report in

In this example, I ran a report for API & internal references in one of the M2 warm up builds. I only included references between org.eclipse.* bundles. What does it show? Lots of stuff.


Tuesday, July 21, 2009

3.6 PDE plan ideas

We have updated our PDE 3.6 plan ideas page here : http://wiki.eclipse.org/PDE/Plan/3.6 so check it out...feedback is always welcome.
Sent on the TELUS Mobility network with BlackBerry

Thursday, June 11, 2009

Breakpoints Not Being Hit?

Just wanted to bring attention to an issue discovered with Sun’s recently released 1.6.0_14 virtual machine. Breakpoints are unreliable - i.e. do not always suspend execution. The problem occurs on Windows and Linux platforms. The associated Eclipse bug is:

https://bugs.eclipse.org/bugs/show_bug.cgi?id=279137

At this point, it appears to be an issue with the VM rather than Eclipse. The workaround is to use the 1.6.0_13 virtual machine.

Friday, May 01, 2009

Target Platforms in 3.5

What a milestone for PDE. Chris has been blogging away about things in M7, and I wanted to talk a little more about the target platform changes coming in M7.

When I started work on PDE UI, this is all I knew about target platforms...


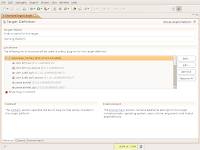
Talk about button overload. So many features, none of which I ever had touched as a debug plug-in developer. I didn't like the UI, I was confused by the 'model' that backed it, and touching anything on that page seemed to break someone (or everyone).

Fortunately, in 3.5 the PDE UI team: Chris A, Darin W, and myself along with Ankur, Ben, Simon and other contributors, had the opportunity to make it better.

The fundamental change is that the preference page is no longer about crafting a target platform. It's about choosing the target you need. There are many new features available and there is a proper model (provisional api as well) so interacting with targets programmatically is much easier.

This was the first time I have written a significant UI component in Eclipse. It has been quite the learning experience and I have even more respect for the platform UI folks and those involved with the p2 UI (which has developed into an excellent experience in 3.5). I received a lot of feedback along the way and have made every effort to develop a UI that respects legacy functionality, simplifies the story while supporting power users, and adds useful eye candy without button overload.


In the future expect even more information to come out about how to work with target platforms, talk about some new ideas we are considering, and posts about some cool features you may not notice at first glance (like p2 provisioned targets). In the meantime, try out M7 and let us know what you think!

Wednesday, April 01, 2009

API Tooling From The Commandline

API tools has a very nice set of tools for analyzing API, creating .api_description files and scanning for API / internal use to mention but a few tasks. Using these tools currently requires you to make the apitooling-ant jar file available in an Eclipse environment or have them as part of a build process.

We though it would be nice to be able to run the tools from the command line as well. With that in mind we have provided a generalized Ant build file that can be used to do just that. The build file in question is available from CVS in the org.eclipse.pde.api.tools project in the scripts folder. Also available in the scripts folder is a properties which is needed to map the task names to the task classes that provide them.

The build file is fairly simple and has a plethora of comments to help you out. It performs 3 main tasks:
1. it builds the Ant classpath based on an Eclipse install
2. it extracts the apitooling-ant.jar from the API tools project jar
3. it runs whichever task you specifiy in the 'run' target

Here is a sample use of the build file for running the API use scans from the command line:

<project name="apiusetask" basedir="." default="run">
<property name="scope" value="/eclipse/eclipse_3.4.2/">
<property name="baseline" value="/eclipse/eclipse.tar.gz">
<property name="xml.report.loc" value="/eclipse/apiuse-commandline/xml">
<property name="html.report.loc" value="/eclipse/apiuse-commandline/html">
<property name="exclude.list.loc" value="/eclipse/exclude.txt">
<property name="eclipse.install.dir" value="/eclipse/eclipse/plugins">
<property name="eclipse.lib.dir" value="/eclipse/lib">
<property name="apiuse.task.props" value="/eclipse/lib/apiuse_tasks.properties">

<target name="init" depends="extract-apitoolingjar">
<taskdef file="${apiuse.task.props}">
<classpath>
<fileset dir="${eclipse.install.dir}">
<include name="*.jar">
</fileset>
<fileset dir="${eclipse.lib.dir}">
<include name="*.jar">
</fileset>
</classpath>
</taskdef>
</target>
<target name="extract-apitoolingjar">
<unjar overwrite="true" dest="${eclipse.lib.dir}">
<fileset dir="${eclipse.install.dir}">
<include name="org.eclipse.pde.api.tools_*.jar">
</fileset>
<patternset>
<include name="**/*.jar">
</patternset>
</unjar>
<move file="${eclipse.lib.dir}/lib/apitooling-ant.jar"
overwrite="true"
todir="${eclipse.lib.dir}"/>
<delete dir="${eclipse.lib.dir}/lib/" includeemptydirs="true">
</target>
<target name="run" depends="init">
<apiuse
baseline="${baseline}"
scope="${scope}"
report="${xml.report.loc}"
excludelist="${exclude.list.loc}"
considerinternal="true"
considerapi="true"
includenonapiprojects="true"
debug="true"
/>
<apiuse_reportconversion
xmlfiles="${xml.report.loc}"
htmlfiles="${html.report.loc}"
debug="true"
/>
</target>
</project>

To actually run the given build file you must have Ant available on the command line (obviously) and then run the following:


root%>ant -buildfile <build file name>

Monday, March 09, 2009

API Use Scanning Now Has A Face

With the API use scanning tooling out the door in Ant task form, I thought it was time to put a face on the feature. I know, I know, why would you need UI for the tools when they are already in Ant task form? Because not everyone is 100% Ant-savvy (myself included) and most users like the tactile feedback of clicking a mouse.

The UI for the scanning feature is not in the official build yet, but fret not, we have provided it on our update site.

To access the UI simply open the search dialog. There are plans in the works to expand the capabilities of the UI to not only scan baselines but to handle API elements in general, for now though you can only scan baselines. Happy scanning.

proposed API use scanning UI

Thursday, February 19, 2009

Eclipse Bespin on Slashdot

So it appears that the Eclipse-based Bespin server created by Boris Bokowski and Simon Kaegi has made it to Slashdot. The comments there reflect my feelings on the whole 'IDEs in the Cloud' concept. It's definitely new and interesting, but how will it be useful to me?

Looking forward to see how this develops in e4.

Tuesday, February 03, 2009

Debugger Breadcrumb

In 3.5M5 Eclipse Platform introduces a Breadcrumb feature in the Debug view. Since it's a platform feature it is automatically available with JDT, CDT, or any commercial debugger built on the Eclipse framework. To see the breadcrumb, simply resize the Debug view to make it really short (about one line of text), and the view will automatically switch.

We hope that this feature will make it easier for users to stay in their regular development perspective for majority of their debugging tasks. For example here's a screen shot of the C/C++ perspective with the Debug view breadcrumb above the editor.


If you'd like to try debugging outside of the Debug perspective, there are two things you need to do:
  1. Disable the automatic switching of perspective when debugging happens. Go to Window->Preferences->Run/Debug->Perspectives and select Never for both of the options that start with Open associated perspective...
  2. Enable view management in your development perspective. Go to Window->Preferences->Run/Debug->View Management and select the check-box for your perspective. This will cause Variables, Breakpoints, and other debugger views to automatically appear and disappear when you need them.
Keep in mind that this is a brand new feature and really a whole new work-flow. We already have a growing list of issues to fix, but if you find something new or have ideas for improvements, let us know.