The first major feature I worked on is adding support for custom detail pane widgets (Bug 75852). This feature allows plugins to contribute new detail panes. The “detail pane” is the area in the variable, expressions and registers view that displays information about the currently selected variable. Up until now, the detail pane could only display text.
Now it can display colours! This custom pane changes background colours depending if the selected element is public/private/etc:
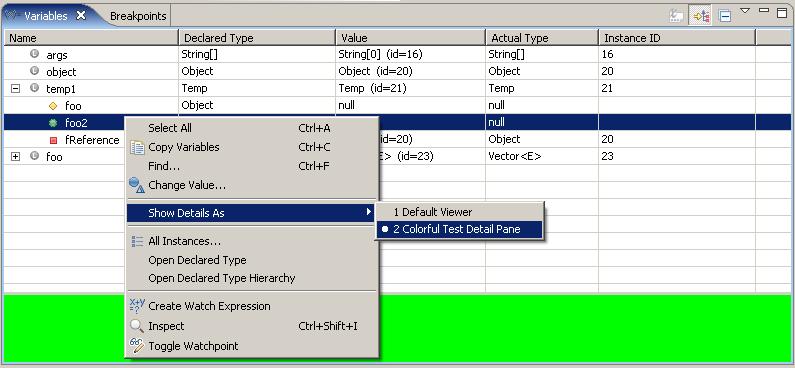
Of course, it can display much more than that. A custom detail pane is defined by implementing org.eclipse.debug.ui.IDetailPane. The pane can contribute any SWT Control, including Composites that contain multiple controls, to the detail pane. When the user makes a selection the custom pane is passed the selection so it can display the information however it wants. The user can use the context menu to choose between the different detail panes available for the current selection.
To contribute a custom detail pane you must use the new extension point org.eclipse.debug.ui.detailPaneFactories. At this extension point you specify a class implementing org.eclipse.debug.ui.IDetailPaneFactory. Each contributed factory will be asked what detail panes that factory can produce for a given selection. A factory can offer different combinations of detail panes depending on the selection. For example, a pane might only be available when 2 or more java variables are selected. To reduce plugin loading, plugins can also add enablement expressions to the extension so that the factory is only instantiated if the selection applies.
We are looking forward to seeing what people can do with this new feature. Leave a comment or send us an e-mail if you create one. In the future we will try to make an example plugin and possibly a short tutorial available.
Welcome Curtis!!!
ReplyDeleteSounds like a good thing. Of cousre, a tutorial/examplette is going to be necessary to get someone else to find out what it is (and is not) capable of.
ReplyDeleteAlex.
very cool, but this lime green color is burning my retina :)
ReplyDeleteOf course, I will sign the comment as 'anonymous' because I am afraid of Curtis who has a black belt in Tae Kwon Do :)
Bullseye! This looks like an exact match for a current feature I am working on. I would like to provide a hierarchical tree view on a specialized hashmap variable. In this case, the keys are path strings (e.g. my/variable/etc). Viewing hashmaps with the default presentation is not very friendly, and, because of the nature of these keys, I would like to display the keys and values in a tree format. I like the detail formatter function, but simple text output is not friendly enough.
ReplyDeleteWill I have write access to the variables from the detail pane as well? It would be nice to allow the user to easily edit the variable.
Any idea on when this would be available?
Updates:
ReplyDeleteRecent comments weren't showing up because comment moderation was turned on when we moved to the new version of Blogger. Comment moderation has been turned off. Just discovered that the detail pane post was resubmitted to Planet Eclipse, oh well.
Detail Panes are now available in inspect popup dialogs. If you are using a different detail pane in the variables view and open a popup, the custom detail pane will be used instead of just text.
This new feature results in a new requirement on detail pane implementors. The spec on IDetailPane has been updated to show that the init method may pass null instead of an IWorkbenchPartSite (since there is no site available for a popup dialog). For the most part this just means the pane should be created without creating context menus.
The pane I used for the screenshot and another example detail pane can be accessed in the org.eclipse.jdt.debug.tests project. One detail pane changes background colour if the selected member is public/private/etc. while the other shows how to create multiple UI components in the detail pane.
See org.eclipse.jdt.debug.testplugin.detailpane.SimpleDetailPane
org.eclipse.jdt.debug.testplugin.detailpane.TableDetailPane
Hi,
ReplyDeleteI'am not sure if I do mistake this for smoething, but I tried to access some variables in the debug-perspective to format the output information in the "detail pane". For this I use the Menue Java->Preferences->Java Logical Structures. I'am a little bit confused about the proceeding and coding in it.
Are there any tutorials where I could read more about this?
Thanks you a lot,
Edo
--
If you want to format the text output in the detail pane, use Java Detail Formatters (Pref Pages > Java > Debug > Detail Formatters).
ReplyDeleteLogical structures allows the children of a variable in the variables view to be changed.
To my knowledge there are no articles or tutorials on these features.
How do you specify the number of characters that a detail pane can show?Looks like values of some variables is truncated.
ReplyDelete"label":"Test","name":"TEST","groups":[{}],"version":"0"}],"version":"21"},"int...
Rather cool place you've got here. Thanks for it. I like such topics and everything connected to this matter. I would like to read more soon.
ReplyDeleteTruly yours
Darek Wish
Where can I find the step by step tutorial or Example Source, which I can use as a reference implementation and I can create my own implementation?
ReplyDeleteThanks In Advance,
Tejash
Technical Help by Tejash