Just a few ideas that can make searching for bugs faster.
1) Use the shortened url
Simply enter the url: bugs.eclipse.org/######
where ###### is the bug number and bugzilla will open the full url (https://bugs.eclipse.org/bugs/show_bug.cgi?id=######)
2) Install the quick search plug-in
From the main page just hit the link: Install the Quick Search plugin.
3) Use Firefox keywords for advanced searches
In Firefox, open up the bugzilla search page and right click on the search field. Select "Add a keyword for this search". This will create a bookmark that you can access directly from the address bar using whatever key word you chose.
Assuming you use 'bug' as a keyword, entering bug 123456 will take you directly to that bug. Entering 'bug import package' will search for bugs with the words in the summary.
Assuming you are logged in, you can use your saved advanced search settings to get more specific results. My default advanced search only looks at certain products/components, so I have a separate keyword for this narrowed search scope.
You can also craft more complex search urls and save them as bookmarks to save a variety of search settings. See Firefox's zine entry on keywords.
Hope this helps save you some time!
Thursday, June 28, 2012


Wednesday, October 12, 2011
Debug Top-level Toolbar
Recently the platform debug team has been working on a new idea for debug-view-less debugging. We have come up with the idea of a top-level toolbar for the common debug commands; so (in theory) you can debug with needing the debug view front and center of your current perspective. The new toolbar can be activated from within the debug view using the View Menu > Debug Toolbar menu item.
The root Eclipse bug for the enhancement is bug 258767
We have already found lots of room for improvement:
bug 359151, bug 264485, bug 360172, bug 360636 and bug 360637
So for all those interested in the debug-view-less debugging idea, please spend some time and try out the new toolbar, just remember to file bugs!
The toolbar look and feel:

The root Eclipse bug for the enhancement is bug 258767
We have already found lots of room for improvement:
bug 359151, bug 264485, bug 360172, bug 360636 and bug 360637
So for all those interested in the debug-view-less debugging idea, please spend some time and try out the new toolbar, just remember to file bugs!
The toolbar look and feel:

Friday, January 14, 2011
Debugging Ant Tasks with Self Hosting
Do you know that Eclipse Ant support has debugging capabilities?
If not, check out this tutorial to get started.
Do you know how to self-host with Eclipse to test plug-ins?
If not here is a quick overview.
To debug ant tasks in a self hosted environment, the tasks must be included in a plug-in project. If you are working with tasks outside of a plug-in development scenario, you can use remote debugging instead. Here is a blog post to get you started.
Scenario:
You are developing an ant task to be included in an Eclipse plug-in. You have the java code to execute the task in a plug-in that defines the task as an ant task extension in the plug-in xml. The task runs, but the output is a bit off. Time to start debugging.
1) Start a runtime workbench
Same as you would when debugging any other plug-in.
2) Create a new ant script
It doesn't matter what kind of project you put the script in.
Fill in the script with the proper targets and properties. When calling your tasks, you will have to put in their full name as defined in the org.eclipse.ant.core.antTasks extension. When running from a built jar, just the name of the class is satisfactory, but when self hosting we need the full name.
3) Create a new ant launch configuration
Right click on the script and hold down Ctrl while clicking "Debug > Ant Script". You can also open the launch config dialog from the main menu, "Run > External Tools > External Tools Configurations".
4) Set up configuration options
Give the configuration a name. On the JRE tab, select "Run in the same JRE as the workspace". If you don't change this option, debugging won't work correctly.
5) Run the configuration
If there is a problem running the task, check that you have the full name of the task written in. You can also check that Ant knows about your task by looking on the Ant > Runtime preference page (the Tasks tab will list all known tasks).
6) Start debugging
Set some breakpoints in the host workspace. Make sure you debug your ant script (not just run it).
Note: Hot Code Replace does not work when debugging this way as the jar containing the tasks must be rebuilt.
If not, check out this tutorial to get started.
Do you know how to self-host with Eclipse to test plug-ins?
If not here is a quick overview.
To debug ant tasks in a self hosted environment, the tasks must be included in a plug-in project. If you are working with tasks outside of a plug-in development scenario, you can use remote debugging instead. Here is a blog post to get you started.
Scenario:
You are developing an ant task to be included in an Eclipse plug-in. You have the java code to execute the task in a plug-in that defines the task as an ant task extension in the plug-in xml. The task runs, but the output is a bit off. Time to start debugging.
1) Start a runtime workbench
Same as you would when debugging any other plug-in.
2) Create a new ant script
It doesn't matter what kind of project you put the script in.
Fill in the script with the proper targets and properties. When calling your tasks, you will have to put in their full name as defined in the org.eclipse.ant.core.antTasks extension. When running from a built jar, just the name of the class is satisfactory, but when self hosting we need the full name.
3) Create a new ant launch configuration
Right click on the script and hold down Ctrl while clicking "Debug > Ant Script". You can also open the launch config dialog from the main menu, "Run > External Tools > External Tools Configurations".
4) Set up configuration options
Give the configuration a name. On the JRE tab, select "Run in the same JRE as the workspace". If you don't change this option, debugging won't work correctly.
5) Run the configuration
If there is a problem running the task, check that you have the full name of the task written in. You can also check that Ant knows about your task by looking on the Ant > Runtime preference page (the Tasks tab will list all known tasks).
6) Start debugging
Set some breakpoints in the host workspace. Make sure you debug your ant script (not just run it).
Note: Hot Code Replace does not work when debugging this way as the jar containing the tasks must be rebuilt.
Wednesday, October 20, 2010
Weird SVN State
Today when I got to work and tried to sync a pile of my projects, I was met with the following exception (and a cute dialog telling me the same thing, but without as many red X's):
org.eclipse.team.svn.core.connector.SVNConnectorException: svn: '/home/mrennie/workspaces/workspace/CommandLineDebugger' is not a working copy
svn: Cannot read from '/home/mrennie/workspaces/workspace/CommandLineDebugger/.svn/format': /home/mrennie/workspaces/workspace/CommandLineDebugger/.svn/format (No such file or directory)
at org.polarion.team.svn.connector.svnkit.SVNKitConnector.handleClientException(SVNKitConnector.java:1400)
at org.polarion.team.svn.connector.svnkit.SVNKitConnector.status(SVNKitConnector.java:337)
at org.eclipse.team.svn.core.extension.factory.ThreadNameModifier.status(ThreadNameModifier.java:608)
at org.eclipse.team.svn.core.operation.local.RemoteStatusOperation$2.run(RemoteStatusOperation.java:147)
at org.eclipse.team.svn.core.utility.ProgressMonitorUtility.doSubTask(ProgressMonitorUtility.java:118)
at org.eclipse.team.svn.core.operation.AbstractActionOperation.protectStep(AbstractActionOperation.java:154)
at org.eclipse.team.svn.core.operation.AbstractActionOperation.protectStep(AbstractActionOperation.java:149)
at org.eclipse.team.svn.core.operation.local.RemoteStatusOperation.runImpl(RemoteStatusOperation.java:145)
at org.eclipse.team.svn.core.operation.AbstractActionOperation.run(AbstractActionOperation.java:81)
at org.eclipse.team.svn.core.utility.ProgressMonitorUtility.doTask(ProgressMonitorUtility.java:104)
at org.eclipse.team.svn.core.operation.CompositeOperation.runImpl(CompositeOperation.java:95)
at org.eclipse.team.svn.core.operation.AbstractActionOperation.run(AbstractActionOperation.java:81)
at org.eclipse.team.svn.core.operation.LoggedOperation.run(LoggedOperation.java:39)
at org.eclipse.team.svn.core.utility.ProgressMonitorUtility.doTask(ProgressMonitorUtility.java:104)
at org.eclipse.team.svn.core.utility.ProgressMonitorUtility.doTaskExternal(ProgressMonitorUtility.java:90)
at org.eclipse.team.svn.core.synchronize.AbstractSVNSubscriber.findChanges(AbstractSVNSubscriber.java:314)
at org.eclipse.team.svn.core.synchronize.AbstractSVNSubscriber$UpdateStatusOperation$2.run(AbstractSVNSubscriber.java:349)
at org.eclipse.team.svn.core.utility.ProgressMonitorUtility.doSubTask(ProgressMonitorUtility.java:118)
at org.eclipse.team.svn.core.operation.AbstractActionOperation.protectStep(AbstractActionOperation.java:154)
at org.eclipse.team.svn.core.operation.AbstractActionOperation.protectStep(AbstractActionOperation.java:149)
at org.eclipse.team.svn.core.synchronize.AbstractSVNSubscriber$UpdateStatusOperation.runImpl(AbstractSVNSubscriber.java:347)
at org.eclipse.team.svn.core.operation.AbstractActionOperation.run(AbstractActionOperation.java:81)
at org.eclipse.team.svn.core.operation.LoggedOperation.run(LoggedOperation.java:39)
at org.eclipse.team.svn.core.utility.ProgressMonitorUtility.doTask(ProgressMonitorUtility.java:104)
at org.eclipse.team.svn.core.utility.ProgressMonitorUtility.doTaskExternal(ProgressMonitorUtility.java:90)
at org.eclipse.team.svn.core.utility.ProgressMonitorUtility.doTaskExternal(ProgressMonitorUtility.java:81)
at org.eclipse.team.svn.core.synchronize.AbstractSVNSubscriber.refresh(AbstractSVNSubscriber.java:186)
at org.eclipse.team.svn.core.synchronize.UpdateSubscriber.refresh(UpdateSubscriber.java:73)
at org.eclipse.team.core.subscribers.Subscriber.refresh(Subscriber.java:466)
at org.eclipse.team.core.subscribers.SubscriberMergeContext.refresh(SubscriberMergeContext.java:85)
at org.eclipse.team.core.mapping.provider.SynchronizationContext.refresh(SynchronizationContext.java:109)
at org.eclipse.team.internal.ui.synchronize.RefreshModelParticipantJob.doRefresh(RefreshModelParticipantJob.java:69)
at org.eclipse.team.internal.ui.synchronize.RefreshParticipantJob.run(RefreshParticipantJob.java:309)
at org.eclipse.team.internal.ui.synchronize.RefreshModelParticipantJob.run(RefreshModelParticipantJob.java:117)
at org.eclipse.core.internal.jobs.Worker.run(Worker.java:54)
Caused by: org.tigris.subversion.javahl.ClientException: svn: '/home/mrennie/workspaces/workspace/CommandLineDebugger' is not a working copy
svn: Cannot read from '/home/mrennie/workspaces/workspace/CommandLineDebugger/.svn/format': /home/mrennie/workspaces/workspace/CommandLineDebugger/.svn/format (No such file or directory)
at org.tigris.subversion.javahl.JavaHLObjectFactory.throwException(JavaHLObjectFactory.java:724)
at org.tmatesoft.svn.core.javahl.SVNClientImpl.throwException(SVNClientImpl.java:1929)
at org.tmatesoft.svn.core.javahl.SVNClientImpl.status(SVNClientImpl.java:304)
at org.tmatesoft.svn.core.javahl.SVNClientImpl.status(SVNClientImpl.java:282)
at org.polarion.team.svn.connector.svnkit.SVNKitConnector.status(SVNKitConnector.java:334)
... 33 more
Caused by: org.tmatesoft.svn.core.SVNException: svn: '/home/mrennie/workspaces/workspace/CommandLineDebugger' is not a working copy
svn: Cannot read from '/home/mrennie/workspaces/workspace/CommandLineDebugger/.svn/format': /home/mrennie/workspaces/workspace/CommandLineDebugger/.svn/format (No such file or directory)
at org.tmatesoft.svn.core.internal.wc.SVNErrorManager.error(SVNErrorManager.java:64)
at org.tmatesoft.svn.core.internal.wc.admin.SVNAdminAreaFactory.open(SVNAdminAreaFactory.java:149)
at org.tmatesoft.svn.core.internal.wc.admin.SVNWCAccess.doOpen(SVNWCAccess.java:355)
at org.tmatesoft.svn.core.internal.wc.admin.SVNWCAccess.open(SVNWCAccess.java:263)
at org.tmatesoft.svn.core.internal.wc.admin.SVNWCAccess.open(SVNWCAccess.java:256)
at org.tmatesoft.svn.core.internal.wc.admin.SVNWCAccess.openAnchor(SVNWCAccess.java:151)
at org.tmatesoft.svn.core.wc.SVNStatusClient.doStatus(SVNStatusClient.java:320)
at org.tmatesoft.svn.core.javahl.SVNClientImpl.status(SVNClientImpl.java:300)
... 35 more
After swearing for a bit and asking Google what I should do (and having no luck) I tried deleting suspicious looking files from the /.svn folder located in each affected project. The winner - at least for me - was to delete the /.svn/tmp folder and all of its contents and then restart Eclipse. After that all is well and I can sync to my hearts content.
I filed a bug for this state problem here:
https://bugs.eclipse.org/bugs/show_bug.cgi?id=328258
org.eclipse.team.svn.core.connector.SVNConnectorException: svn: '/home/mrennie/workspaces/workspace/CommandLineDebugger' is not a working copy
svn: Cannot read from '/home/mrennie/workspaces/workspace/CommandLineDebugger/.svn/format': /home/mrennie/workspaces/workspace/CommandLineDebugger/.svn/format (No such file or directory)
at org.polarion.team.svn.connector.svnkit.SVNKitConnector.handleClientException(SVNKitConnector.java:1400)
at org.polarion.team.svn.connector.svnkit.SVNKitConnector.status(SVNKitConnector.java:337)
at org.eclipse.team.svn.core.extension.factory.ThreadNameModifier.status(ThreadNameModifier.java:608)
at org.eclipse.team.svn.core.operation.local.RemoteStatusOperation$2.run(RemoteStatusOperation.java:147)
at org.eclipse.team.svn.core.utility.ProgressMonitorUtility.doSubTask(ProgressMonitorUtility.java:118)
at org.eclipse.team.svn.core.operation.AbstractActionOperation.protectStep(AbstractActionOperation.java:154)
at org.eclipse.team.svn.core.operation.AbstractActionOperation.protectStep(AbstractActionOperation.java:149)
at org.eclipse.team.svn.core.operation.local.RemoteStatusOperation.runImpl(RemoteStatusOperation.java:145)
at org.eclipse.team.svn.core.operation.AbstractActionOperation.run(AbstractActionOperation.java:81)
at org.eclipse.team.svn.core.utility.ProgressMonitorUtility.doTask(ProgressMonitorUtility.java:104)
at org.eclipse.team.svn.core.operation.CompositeOperation.runImpl(CompositeOperation.java:95)
at org.eclipse.team.svn.core.operation.AbstractActionOperation.run(AbstractActionOperation.java:81)
at org.eclipse.team.svn.core.operation.LoggedOperation.run(LoggedOperation.java:39)
at org.eclipse.team.svn.core.utility.ProgressMonitorUtility.doTask(ProgressMonitorUtility.java:104)
at org.eclipse.team.svn.core.utility.ProgressMonitorUtility.doTaskExternal(ProgressMonitorUtility.java:90)
at org.eclipse.team.svn.core.synchronize.AbstractSVNSubscriber.findChanges(AbstractSVNSubscriber.java:314)
at org.eclipse.team.svn.core.synchronize.AbstractSVNSubscriber$UpdateStatusOperation$2.run(AbstractSVNSubscriber.java:349)
at org.eclipse.team.svn.core.utility.ProgressMonitorUtility.doSubTask(ProgressMonitorUtility.java:118)
at org.eclipse.team.svn.core.operation.AbstractActionOperation.protectStep(AbstractActionOperation.java:154)
at org.eclipse.team.svn.core.operation.AbstractActionOperation.protectStep(AbstractActionOperation.java:149)
at org.eclipse.team.svn.core.synchronize.AbstractSVNSubscriber$UpdateStatusOperation.runImpl(AbstractSVNSubscriber.java:347)
at org.eclipse.team.svn.core.operation.AbstractActionOperation.run(AbstractActionOperation.java:81)
at org.eclipse.team.svn.core.operation.LoggedOperation.run(LoggedOperation.java:39)
at org.eclipse.team.svn.core.utility.ProgressMonitorUtility.doTask(ProgressMonitorUtility.java:104)
at org.eclipse.team.svn.core.utility.ProgressMonitorUtility.doTaskExternal(ProgressMonitorUtility.java:90)
at org.eclipse.team.svn.core.utility.ProgressMonitorUtility.doTaskExternal(ProgressMonitorUtility.java:81)
at org.eclipse.team.svn.core.synchronize.AbstractSVNSubscriber.refresh(AbstractSVNSubscriber.java:186)
at org.eclipse.team.svn.core.synchronize.UpdateSubscriber.refresh(UpdateSubscriber.java:73)
at org.eclipse.team.core.subscribers.Subscriber.refresh(Subscriber.java:466)
at org.eclipse.team.core.subscribers.SubscriberMergeContext.refresh(SubscriberMergeContext.java:85)
at org.eclipse.team.core.mapping.provider.SynchronizationContext.refresh(SynchronizationContext.java:109)
at org.eclipse.team.internal.ui.synchronize.RefreshModelParticipantJob.doRefresh(RefreshModelParticipantJob.java:69)
at org.eclipse.team.internal.ui.synchronize.RefreshParticipantJob.run(RefreshParticipantJob.java:309)
at org.eclipse.team.internal.ui.synchronize.RefreshModelParticipantJob.run(RefreshModelParticipantJob.java:117)
at org.eclipse.core.internal.jobs.Worker.run(Worker.java:54)
Caused by: org.tigris.subversion.javahl.ClientException: svn: '/home/mrennie/workspaces/workspace/CommandLineDebugger' is not a working copy
svn: Cannot read from '/home/mrennie/workspaces/workspace/CommandLineDebugger/.svn/format': /home/mrennie/workspaces/workspace/CommandLineDebugger/.svn/format (No such file or directory)
at org.tigris.subversion.javahl.JavaHLObjectFactory.throwException(JavaHLObjectFactory.java:724)
at org.tmatesoft.svn.core.javahl.SVNClientImpl.throwException(SVNClientImpl.java:1929)
at org.tmatesoft.svn.core.javahl.SVNClientImpl.status(SVNClientImpl.java:304)
at org.tmatesoft.svn.core.javahl.SVNClientImpl.status(SVNClientImpl.java:282)
at org.polarion.team.svn.connector.svnkit.SVNKitConnector.status(SVNKitConnector.java:334)
... 33 more
Caused by: org.tmatesoft.svn.core.SVNException: svn: '/home/mrennie/workspaces/workspace/CommandLineDebugger' is not a working copy
svn: Cannot read from '/home/mrennie/workspaces/workspace/CommandLineDebugger/.svn/format': /home/mrennie/workspaces/workspace/CommandLineDebugger/.svn/format (No such file or directory)
at org.tmatesoft.svn.core.internal.wc.SVNErrorManager.error(SVNErrorManager.java:64)
at org.tmatesoft.svn.core.internal.wc.admin.SVNAdminAreaFactory.open(SVNAdminAreaFactory.java:149)
at org.tmatesoft.svn.core.internal.wc.admin.SVNWCAccess.doOpen(SVNWCAccess.java:355)
at org.tmatesoft.svn.core.internal.wc.admin.SVNWCAccess.open(SVNWCAccess.java:263)
at org.tmatesoft.svn.core.internal.wc.admin.SVNWCAccess.open(SVNWCAccess.java:256)
at org.tmatesoft.svn.core.internal.wc.admin.SVNWCAccess.openAnchor(SVNWCAccess.java:151)
at org.tmatesoft.svn.core.wc.SVNStatusClient.doStatus(SVNStatusClient.java:320)
at org.tmatesoft.svn.core.javahl.SVNClientImpl.status(SVNClientImpl.java:300)
... 35 more
After swearing for a bit and asking Google what I should do (and having no luck) I tried deleting suspicious looking files from the /.svn folder located in each affected project. The winner - at least for me - was to delete the /.svn/tmp folder and all of its contents and then restart Eclipse. After that all is well and I can sync to my hearts content.
I filed a bug for this state problem here:
https://bugs.eclipse.org/bugs/show_bug.cgi?id=328258
Wednesday, September 15, 2010
How p2 based targets work
Software Site locations in Target Definitions, typically described as "p2 based targets" are targets that get their bundles from an update site or p2 repository. This article will go over some of the implementation details of these targets. Knowing how the bundles are downloaded and added to the target can help to reproduce bugs and find workarounds.
For more general information on Target Platforms, see my previous article. The Eclipse help doc also explains a lot about how to create p2 based targets and add content to them.
The Basics:
Target definitions are created using the preference page or the editor. To create a p2 based target, at least one 'software site' location must be added to the target. The actual site location is abstracted from PDE. A local zipped repo, a remote site or a local profile will all be treated the same. A software site location specifies a site (or a category such as "all available sites") as well as one or more Root IUs. The root IUs describe what is being downloaded from the site, they are often high level features that effectively group a collection of bundles.
Target definitions must be resolved to modify the bundle list on the content tab or to set one as the active target platform. The resolve operation runs for each location independently. For most locations the resolve simply scans the location to get a list of file locations for bundles. In the case of a software site location, a more complex operation must be run.
Resolving Software Sites:
For each software site location, the following steps are taken:
Important Locations:
The following directories describe where PDE/p2 stores information related to the target resolution. Those familiar with p2 can modify the contents of the directories to force things to be recreated or to use the contents for a special purpose.
Target Definition Files:
/.metadata/.plugins/org.eclipse.pde.core/.local_targets
Where PDE stores the targets it creates from the preference page.
Profile Location:
/p2/org.eclipse.equinox.p2.engine/profileRegistry
Where profiles are created and persisted
Bundle Pool:
/.metadata/.plugins/org.eclipse.pde.core/.bundle_pool
Where p2 will download the bundles to during the operation
Planning vs Slicing
Once we have one or more sites and root IUs, we run a provisioning operation to download the required bundles and install them into a profile. The operation can be done using a slicer, which is typically used for mirroring a site or a planner, which is used by Eclipse to safely install and update itself.
Which one to use is determined by the options at the bottom of the wizard when editing a software site location. If "Include required software" is checked the planner is used. If unchecked the slicer is used. The include all environments setting determines if environment properties are set on the slicer.
The planner behaves the same as though we were installing the root IUs into an application. Therefore it checks that the complete set of required IUs are available to be downloaded and installed. If any IU is missing, the planner will report an error saying that a requirement is missing. This can be convenient as you may not realize some important piece is missing from your target. However, the target does not need to be a complete, runnable install, so forcibly requiring everything may be optimal.
The slicer uses an operation that copies IUs from a remote site to a local location. The slicer does create a list of required IUs, however it does not fail if the requirements are missing. Instead it will download all requirements it can from the site or sites that have been provided. This is a lot more flexible than the planner as all available IUs (even IUs that don't apply to the current environment settings) will be downloaded.
Conclusion:
After the resolve operation is complete, a list of bundles will be returned (pointing to the local copies in the bundle pool). PDE will use the local bundles as the target.
For more general information on Target Platforms, see my previous article. The Eclipse help doc also explains a lot about how to create p2 based targets and add content to them.
The Basics:
Target definitions are created using the preference page or the editor. To create a p2 based target, at least one 'software site' location must be added to the target. The actual site location is abstracted from PDE. A local zipped repo, a remote site or a local profile will all be treated the same. A software site location specifies a site (or a category such as "all available sites") as well as one or more Root IUs. The root IUs describe what is being downloaded from the site, they are often high level features that effectively group a collection of bundles.
Target definitions must be resolved to modify the bundle list on the content tab or to set one as the active target platform. The resolve operation runs for each location independently. For most locations the resolve simply scans the location to get a list of file locations for bundles. In the case of a software site location, a more complex operation must be run.
Resolving Software Sites:
For each software site location, the following steps are taken:
- Load the repositories. This will create a queryable repository object. p2 will often request a repo's contents.xml file.
- Get the root IUs. If the location didn't already have actual installable units for the root units, the root IUs will be obtained from the site.
- Setup the planner or slicer. More on this later.
- Create a profile.
- Run the operation. Downloads and installs the units into the profile.
- Collect bundle locations for the target platform.
Important Locations:
The following directories describe where PDE/p2 stores information related to the target resolution. Those familiar with p2 can modify the contents of the directories to force things to be recreated or to use the contents for a special purpose.
Target Definition Files:
Where PDE stores the targets it creates from the preference page.
Profile Location:
Where profiles are created and persisted
Bundle Pool:
Where p2 will download the bundles to during the operation
Planning vs Slicing
Once we have one or more sites and root IUs, we run a provisioning operation to download the required bundles and install them into a profile. The operation can be done using a slicer, which is typically used for mirroring a site or a planner, which is used by Eclipse to safely install and update itself.
Which one to use is determined by the options at the bottom of the wizard when editing a software site location. If "Include required software" is checked the planner is used. If unchecked the slicer is used. The include all environments setting determines if environment properties are set on the slicer.
The planner behaves the same as though we were installing the root IUs into an application. Therefore it checks that the complete set of required IUs are available to be downloaded and installed. If any IU is missing, the planner will report an error saying that a requirement is missing. This can be convenient as you may not realize some important piece is missing from your target. However, the target does not need to be a complete, runnable install, so forcibly requiring everything may be optimal.
The slicer uses an operation that copies IUs from a remote site to a local location. The slicer does create a list of required IUs, however it does not fail if the requirements are missing. Instead it will download all requirements it can from the site or sites that have been provided. This is a lot more flexible than the planner as all available IUs (even IUs that don't apply to the current environment settings) will be downloaded.
Conclusion:
After the resolve operation is complete, a list of bundles will be returned (pointing to the local copies in the bundle pool). PDE will use the local bundles as the target.
What is a Target Platform
The current Target Platform in PDE is very important to anyone developing bundles in Eclipse. Whether you are developing SDK Plug-ins, an RCP product or a OSGi application, managing the contents of your target platform is important.
So what is a target platform?
At its core, a target platform is a collection of plug-ins (aka bundles) that PDE can use to compile against, launch with, lookup information in and more. When developing a bundle it is almost guaranteed that you will depend on other bundles. While you can have the complete required set of bundles in your workspace, it clutters the navigator views and degrades performance. The target platform provides an easy way to manage the bundles you build against.
The target platform is used for the following in PDE:
Where do I edit the target platform?
The target platform is managed on the PDE > Target Platform preference page. When you go to that page (3.5 and later) you will see a list of all the target definitions you have available with the current target platform bolded. PDE only has a single active target platform that all bundles in the workspace use (this might change someday).
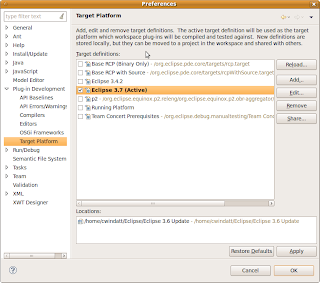
However, you can have multiple target definitions. A target definition describes the contents of a target. You can select any target definition as the target platform and that is what PDE will build against. For users who only build one product, you only need to create and modify a single definition, but users who develop different applications (or different versions of the same application) in the same workspace will find that having multiple target definitions makes it easy to switch modes.
How do I create a target?
To get started, go to the preference page and hit add to create a new target. There are some options to create targets from existing templates, but for now select Nothing and hit next.
There are many options when setting up a target, but only a few are needed for basic setups. The first step is to give the target definition a name so we can recognize it later.
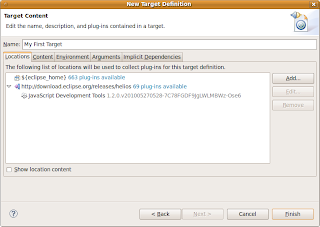
The important parts of a target definition is its locations and its content. The locations define where the target should find bundles, the content defines which bundles from the location to take.
On the locations tab you can add 4 types of locations. A directory will just collect any bundles found in the directory you point it to. An installation will treat the location as an Eclipse application. Rather than just looking in a directory, the installation location will consider link folders, a platform.xml if the app uses update manager, or a bundles.info file if the app uses p2 (simple configurator). A feature location will add a single feature and its included bundles to the target. Finally, a software site location will allow bundles to be retrieved from a local or remote update site or p2 repository.
The content tab is only important if you need to limit the bundles in the target. For plug-in developers this step is unecessary, but for RCP developers it can be more important. This article explains the reasoning. The content tab will list all the bundles in the target, along with check boxes to remove them. The tab also provides a number of ways to filter the list so you can quickly remove certain types.
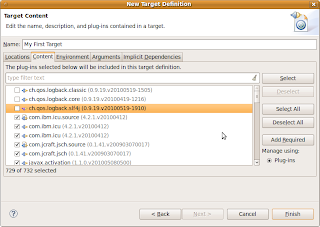
One internal detail that target platform users may want to know is that when bundles are unchecked, the remaining list of bundles is stored as an include list, independant of the locations. This was a change from the <3.5 style="font-style: italic;">share
What other features use targets?
The Target Platform State View can be used to see what is in your target.
Add new content to your target on the fly.
You can export the contents of your target platform.
Manage your target contents using features.
Add the target platform to the java search path.
What is in the future for targets?
In 3.7 there have been multiple improvements around software site (p2) based targets, including improved resolution performance and better offline support. PDE's API Tooling features already leverage some of the target code, but hopefully in the near future there will be even better integration.
Expect another blog post soon explaining more about how p2 targets work.
So what is a target platform?
At its core, a target platform is a collection of plug-ins (aka bundles) that PDE can use to compile against, launch with, lookup information in and more. When developing a bundle it is almost guaranteed that you will depend on other bundles. While you can have the complete required set of bundles in your workspace, it clutters the navigator views and degrades performance. The target platform provides an easy way to manage the bundles you build against.
The target platform is used for the following in PDE:
- Compile - Plug-ins in the workspace are built against the target platform so you do not have to have everything in your workspace
- Launch - When using PDE's launchers you can choose the set of plug-ins you want to launch. By default the Eclipse Application Launcher will start with all plug-ins in the target, but will use workspace plug-ins instead when available
- Calculate Dependencies - PDE assists you in finding the plug-ins your plug-ins was include/require to compile correctly by looking at what is available in the target platform
Where do I edit the target platform?
The target platform is managed on the PDE > Target Platform preference page. When you go to that page (3.5 and later) you will see a list of all the target definitions you have available with the current target platform bolded. PDE only has a single active target platform that all bundles in the workspace use (this might change someday).

However, you can have multiple target definitions. A target definition describes the contents of a target. You can select any target definition as the target platform and that is what PDE will build against. For users who only build one product, you only need to create and modify a single definition, but users who develop different applications (or different versions of the same application) in the same workspace will find that having multiple target definitions makes it easy to switch modes.
How do I create a target?
To get started, go to the preference page and hit add to create a new target. There are some options to create targets from existing templates, but for now select Nothing and hit next.
There are many options when setting up a target, but only a few are needed for basic setups. The first step is to give the target definition a name so we can recognize it later.

The important parts of a target definition is its locations and its content. The locations define where the target should find bundles, the content defines which bundles from the location to take.
On the locations tab you can add 4 types of locations. A directory will just collect any bundles found in the directory you point it to. An installation will treat the location as an Eclipse application. Rather than just looking in a directory, the installation location will consider link folders, a platform.xml if the app uses update manager, or a bundles.info file if the app uses p2 (simple configurator). A feature location will add a single feature and its included bundles to the target. Finally, a software site location will allow bundles to be retrieved from a local or remote update site or p2 repository.
The content tab is only important if you need to limit the bundles in the target. For plug-in developers this step is unecessary, but for RCP developers it can be more important. This article explains the reasoning. The content tab will list all the bundles in the target, along with check boxes to remove them. The tab also provides a number of ways to filter the list so you can quickly remove certain types.

One internal detail that target platform users may want to know is that when bundles are unchecked, the remaining list of bundles is stored as an include list, independant of the locations. This was a change from the <3.5 style="font-style: italic;">share
What other features use targets?
The Target Platform State View can be used to see what is in your target.
Add new content to your target on the fly.
You can export the contents of your target platform.
Manage your target contents using features.
Add the target platform to the java search path.
What is in the future for targets?
In 3.7 there have been multiple improvements around software site (p2) based targets, including improved resolution performance and better offline support. PDE's API Tooling features already leverage some of the target code, but hopefully in the near future there will be even better integration.
Expect another blog post soon explaining more about how p2 targets work.
Thursday, May 13, 2010
"Add new expression" inline in Expressions View

The debugger expressions view has a new feature: the ability to add a new expression without opening a dialog. When user clicks on "Add new expression" entry, a cell editor is activated to enter the new expression.
I hope most people will appreciate this little convenience but since introducing it few months ago I got one complaint and a request to make it optional. What do you think? Is it worth adding yet another preference to try to make everyone happy?
Wednesday, September 16, 2009
API Use Reports
It's no longer rocket science - mere mortals can create API Use Reports using Eclipse 3.6 M2. Report generation is integrated as an external tool. Simply open the External Tools dialog (Run > External Tools > External Tools Configurations...), create a new "API Use Report" configuration, tweak settings, and press "Run".

You have to specify:

You have to specify:
- The bundles to analyze (which can be provided as an API baseline, a PDE target definition, or simply as a directory)
- Whether to report API and/or internal references
- Optionally, the scope to analyze (use regular expressions to include bundles to search and bundles you are interested in references to, or leave blank to scan everything)
- A directory to write the report in
In this example, I ran a report for API & internal references in one of the M2 warm up builds. I only included references between org.eclipse.* bundles. What does it show? Lots of stuff.

Tuesday, July 21, 2009
3.6 PDE plan ideas
We have updated our PDE 3.6 plan ideas page here : http://wiki.eclipse.org/PDE/Plan/3.6 so check it out...feedback is always welcome.
Sent on the TELUS Mobility network with BlackBerry
Sent on the TELUS Mobility network with BlackBerry
Thursday, June 11, 2009
Breakpoints Not Being Hit?
Just wanted to bring attention to an issue discovered with Sun’s recently released 1.6.0_14 virtual machine. Breakpoints are unreliable - i.e. do not always suspend execution. The problem occurs on Windows and Linux platforms. The associated Eclipse bug is:
https://bugs.eclipse.org/bugs/show_bug.cgi?id=279137
At this point, it appears to be an issue with the VM rather than Eclipse. The workaround is to use the 1.6.0_13 virtual machine.
Friday, May 01, 2009
Target Platforms in 3.5
What a milestone for PDE. Chris has been blogging away about things in M7, and I wanted to talk a little more about the target platform changes coming in M7.
When I started work on PDE UI, this is all I knew about target platforms...

Talk about button overload. So many features, none of which I ever had touched as a debug plug-in developer. I didn't like the UI, I was confused by the 'model' that backed it, and touching anything on that page seemed to break someone (or everyone).
Fortunately, in 3.5 the PDE UI team: Chris A, Darin W, and myself along with Ankur, Ben, Simon and other contributors, had the opportunity to make it better.
 The fundamental change is that the preference page is no longer about crafting a target platform. It's about choosing the target you need. There are many new features available and there is a proper model (provisional api as well) so interacting with targets programmatically is much easier.
This was the first time I have written a significant UI component in Eclipse. It has been quite the learning experience and I have even more respect for the platform UI folks and those involved with the p2 UI (which has developed into an excellent experience in 3.5). I received a lot of feedback along the way and have made every effort to develop a UI that respects legacy functionality, simplifies the story while supporting power users, and adds useful eye candy without button overload.
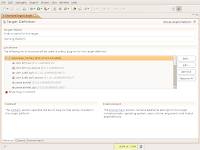


In the future expect even more information to come out about how to work with target platforms, talk about some new ideas we are considering, and posts about some cool features you may not notice at first glance (like p2 provisioned targets). In the meantime, try out M7 and let us know what you think!
When I started work on PDE UI, this is all I knew about target platforms...

Talk about button overload. So many features, none of which I ever had touched as a debug plug-in developer. I didn't like the UI, I was confused by the 'model' that backed it, and touching anything on that page seemed to break someone (or everyone).
Fortunately, in 3.5 the PDE UI team: Chris A, Darin W, and myself along with Ankur, Ben, Simon and other contributors, had the opportunity to make it better.
 The fundamental change is that the preference page is no longer about crafting a target platform. It's about choosing the target you need. There are many new features available and there is a proper model (provisional api as well) so interacting with targets programmatically is much easier.
This was the first time I have written a significant UI component in Eclipse. It has been quite the learning experience and I have even more respect for the platform UI folks and those involved with the p2 UI (which has developed into an excellent experience in 3.5). I received a lot of feedback along the way and have made every effort to develop a UI that respects legacy functionality, simplifies the story while supporting power users, and adds useful eye candy without button overload.


In the future expect even more information to come out about how to work with target platforms, talk about some new ideas we are considering, and posts about some cool features you may not notice at first glance (like p2 provisioned targets). In the meantime, try out M7 and let us know what you think!
Wednesday, April 01, 2009
API Tooling From The Commandline
API tools has a very nice set of tools for analyzing API, creating .api_description files and scanning for API / internal use to mention but a few tasks. Using these tools currently requires you to make the apitooling-ant jar file available in an Eclipse environment or have them as part of a build process.
We though it would be nice to be able to run the tools from the command line as well. With that in mind we have provided a generalized Ant build file that can be used to do just that. The build file in question is available from CVS in the org.eclipse.pde.api.tools project in the scripts folder. Also available in the scripts folder is a properties which is needed to map the task names to the task classes that provide them.
The build file is fairly simple and has a plethora of comments to help you out. It performs 3 main tasks:
1. it builds the Ant classpath based on an Eclipse install
2. it extracts the apitooling-ant.jar from the API tools project jar
3. it runs whichever task you specifiy in the 'run' target
Here is a sample use of the build file for running the API use scans from the command line:
To actually run the given build file you must have Ant available on the command line (obviously) and then run the following:
We though it would be nice to be able to run the tools from the command line as well. With that in mind we have provided a generalized Ant build file that can be used to do just that. The build file in question is available from CVS in the org.eclipse.pde.api.tools project in the scripts folder. Also available in the scripts folder is a properties which is needed to map the task names to the task classes that provide them.
The build file is fairly simple and has a plethora of comments to help you out. It performs 3 main tasks:
1. it builds the Ant classpath based on an Eclipse install
2. it extracts the apitooling-ant.jar from the API tools project jar
3. it runs whichever task you specifiy in the 'run' target
Here is a sample use of the build file for running the API use scans from the command line:
<project name="apiusetask" basedir="." default="run">
    <property name="scope" value="/eclipse/eclipse_3.4.2/">
    <property name="baseline" value="/eclipse/eclipse.tar.gz">
    <property name="xml.report.loc" value="/eclipse/apiuse-commandline/xml">
    <property name="html.report.loc" value="/eclipse/apiuse-commandline/html">
    <property name="exclude.list.loc" value="/eclipse/exclude.txt">
    <property name="eclipse.install.dir" value="/eclipse/eclipse/plugins">
    <property name="eclipse.lib.dir" value="/eclipse/lib">
    <property name="apiuse.task.props" value="/eclipse/lib/apiuse_tasks.properties">

    <target name="init" depends="extract-apitoolingjar">
        <taskdef file="${apiuse.task.props}">
            <classpath>
                <fileset dir="${eclipse.install.dir}">
                    <include name="*.jar">
                </fileset>
                <fileset dir="${eclipse.lib.dir}">
                    <include name="*.jar">
                </fileset>
            </classpath>
        </taskdef>
    </target>
    <target name="extract-apitoolingjar">
        <unjar overwrite="true" dest="${eclipse.lib.dir}">
            <fileset dir="${eclipse.install.dir}">
                <include name="org.eclipse.pde.api.tools_*.jar">
            </fileset>
            <patternset>
                <include name="**/*.jar">
            </patternset>
        </unjar>
        <move file="${eclipse.lib.dir}/lib/apitooling-ant.jar"
                     overwrite="true"
                     todir="${eclipse.lib.dir}"/>
        <delete dir="${eclipse.lib.dir}/lib/" includeemptydirs="true">
    </target>
    <target name="run" depends="init">
        <apiuse
            baseline="${baseline}"
            scope="${scope}"
            report="${xml.report.loc}"
            excludelist="${exclude.list.loc}"
            considerinternal="true"
            considerapi="true"
            includenonapiprojects="true"
            debug="true"
        />
        <apiuse_reportconversion
            xmlfiles="${xml.report.loc}"
            htmlfiles="${html.report.loc}"
            debug="true"
        />
    </target>
</project>
To actually run the given build file you must have Ant available on the command line (obviously) and then run the following:
root%>ant -buildfile <build file name>
Monday, March 09, 2009
API Use Scanning Now Has A Face
With the API use scanning tooling out the door in Ant task form, I thought it was time to put a face on the feature. I know, I know, why would you need UI for the tools when they are already in Ant task form? Because not everyone is 100% Ant-savvy (myself included) and most users like the tactile feedback of clicking a mouse.
The UI for the scanning feature is not in the official build yet, but fret not, we have provided it on our update site.
To access the UI simply open the search dialog. There are plans in the works to expand the capabilities of the UI to not only scan baselines but to handle API elements in general, for now though you can only scan baselines. Happy scanning.

The UI for the scanning feature is not in the official build yet, but fret not, we have provided it on our update site.
To access the UI simply open the search dialog. There are plans in the works to expand the capabilities of the UI to not only scan baselines but to handle API elements in general, for now though you can only scan baselines. Happy scanning.

Thursday, February 19, 2009
Eclipse Bespin on Slashdot
So it appears that the Eclipse-based Bespin server created by Boris Bokowski and Simon Kaegi has made it to Slashdot. The comments there reflect my feelings on the whole 'IDEs in the Cloud' concept. It's definitely new and interesting, but how will it be useful to me?
Looking forward to see how this develops in e4.
Looking forward to see how this develops in e4.
Tuesday, February 03, 2009
Debugger Breadcrumb
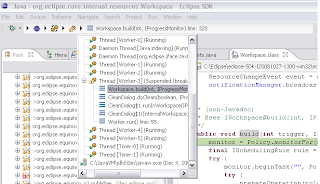
In 3.5M5 Eclipse Platform introduces a Breadcrumb feature in the Debug view. Since it's a platform feature it is automatically available with JDT, CDT, or any commercial debugger built on the Eclipse framework. To see the breadcrumb, simply resize the Debug view to make it really short (about one line of text), and the view will automatically switch.
We hope that this feature will make it easier for users to stay in their regular development perspective for majority of their debugging tasks. For example here's a screen shot of the C/C++ perspective with the Debug view breadcrumb above the editor.

If you'd like to try debugging outside of the Debug perspective, there are two things you need to do:
We hope that this feature will make it easier for users to stay in their regular development perspective for majority of their debugging tasks. For example here's a screen shot of the C/C++ perspective with the Debug view breadcrumb above the editor.

If you'd like to try debugging outside of the Debug perspective, there are two things you need to do:
- Disable the automatic switching of perspective when debugging happens. Go to Window->Preferences->Run/Debug->Perspectives and select Never for both of the options that start with Open associated perspective...
- Enable view management in your development perspective. Go to Window->Preferences->Run/Debug->View Management and select the check-box for your perspective. This will cause Variables, Breakpoints, and other debugger views to automatically appear and disappear when you need them.
Thursday, December 18, 2008
Debug Unit Tests
There was a recent blog post asking whether the debug framework had any unit tests and if so, where we were hiding them. Yes we do have a test suite to help protect against regressions and we hide it in the org.eclipse.jdt.debug.tests plug-in.
The majority of the tests require some implementation of the debug framework to run. We are responsible for the JDT Debugger, which is part of the SDK and implements the majority of the standard debug model. So the tests were designed to use JDT.
Until Dave brought the idea up, I had never thought of anyone using unit tests to help implement their own debugger. The current tests certainly are not set up for this style of development. I think it would be really cool to have a generic testing harness that checks the behaviour of the framework. Users could have the test harness run against their implementations of the debug interfaces/extensions. Perhaps Bug 259145 could evolve into something like that.
The majority of the tests require some implementation of the debug framework to run. We are responsible for the JDT Debugger, which is part of the SDK and implements the majority of the standard debug model. So the tests were designed to use JDT.
Until Dave brought the idea up, I had never thought of anyone using unit tests to help implement their own debugger. The current tests certainly are not set up for this style of development. I think it would be really cool to have a generic testing harness that checks the behaviour of the framework. Users could have the test harness run against their implementations of the debug interfaces/extensions. Perhaps Bug 259145 could evolve into something like that.
Thursday, December 04, 2008
Delivering Feature Patches - Part II
This post will go over the basics of creating a Feature Patch, the most robust option when wanting to deliver some code changes, as discussed in my previous post.
First we must grab the bundles we are changing and edit the code. For this example I grabbed the org.eclipse.debug.ui bundle from CVS and applied the latest patch for the new Debug Breadcrumbs feature Pawel is working on.
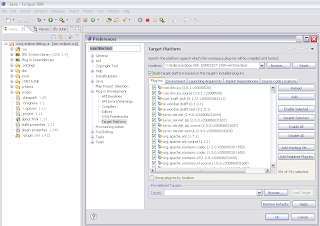
You must also set up your target platform (Window > Preferences > PDE > Target Platform) to be what your intended client is using. Your target platform will determine what feature version you are going to patch. Therefore, to create a patch against 3.4.1, make sure to set your target platform to a 3.4.1 install. In this example I am using my default target platform (the latest I build).
Note that at this point, we could use PDE to launch a runtime workbench and test out the changes immediately.
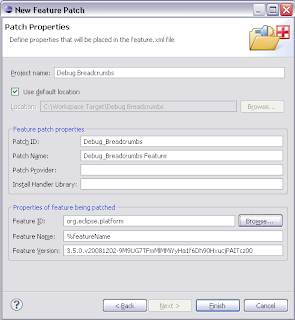
Now to create the feature patch, use File > New > PDE > Feature Patch. This brings up a wizard with multiple dialogs to fill in.
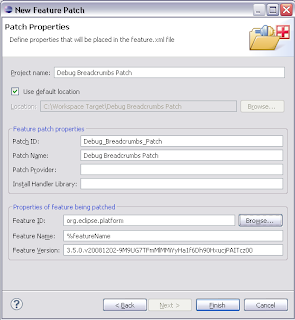
You will have to choose a project name which is the name of the project that will be created in your workspace. Then you must choose a patch ID and name, which will be what your user sees when they try and install the patch. Finally, you must choose the feature which you are patching. Hitting the browse button will allow you to select one of the features from your target platform, and the name and version will be filled in for you.
Hitting finish will bring up the feaure patch editor where you can edit many more things. For the simple case, we are going to move directly to the Plug-ins tab of the editor. Here, we will specify what new bundles the feature will have. Hit the Add... button and select your workspace bundle. You don't have to specify a version for the bundle because by default we will set the proper versions when we export.
 The next step is to export the patch. PDE provides a convenient button in the top right section of the editor which will open the export dialog. Choose a directory where you want to export (you can move this folder to a website later to make it available remotely). You can also export to a jar file.
 On this wizard it is also very important to go to the options tab and turn on the "package as individual jar archives" and "generate metadata" options. These options are required for p2 to be able to understand and install the patch.
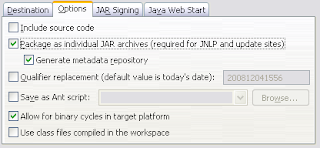
Hit the finish button, wait for the operation to complete and we're done!
To install the patch, we go to Help > Install New Software... Hit the Add Site button and select the directory we exported to (or the remote location, or the jar file). The dialog should now show our patch, check it and hit next to begin the install. You will have to step through a few pages to accept the license agreement.
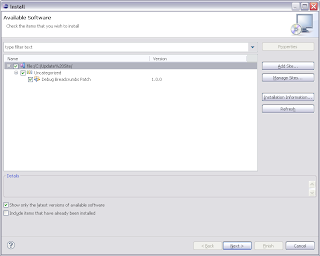
After the install completes, we are prompted to restart eclipse (highly recommended). When Eclipse returns, we have a brand new feature to play around with.
So there you go, the basics of creating a feature patch!
Optional: Instead of exporting the patch directly, you can also use an update site project with a site.xml to deliver the patch. Simply open an existing site.xml or create a new site project (File > New... > PDE > Update Site Project), hit the add button, select your feature patch project, and build the site. Using a update site project will generate an html page as well as allow the pre-p2 update manager to access the site.
First we must grab the bundles we are changing and edit the code. For this example I grabbed the org.eclipse.debug.ui bundle from CVS and applied the latest patch for the new Debug Breadcrumbs feature Pawel is working on.
You must also set up your target platform (Window > Preferences > PDE > Target Platform) to be what your intended client is using. Your target platform will determine what feature version you are going to patch. Therefore, to create a patch against 3.4.1, make sure to set your target platform to a 3.4.1 install. In this example I am using my default target platform (the latest I build).
Note that at this point, we could use PDE to launch a runtime workbench and test out the changes immediately.

Now to create the feature patch, use File > New > PDE > Feature Patch. This brings up a wizard with multiple dialogs to fill in.

You will have to choose a project name which is the name of the project that will be created in your workspace. Then you must choose a patch ID and name, which will be what your user sees when they try and install the patch. Finally, you must choose the feature which you are patching. Hitting the browse button will allow you to select one of the features from your target platform, and the name and version will be filled in for you.
Hitting finish will bring up the feaure patch editor where you can edit many more things. For the simple case, we are going to move directly to the Plug-ins tab of the editor. Here, we will specify what new bundles the feature will have. Hit the Add... button and select your workspace bundle. You don't have to specify a version for the bundle because by default we will set the proper versions when we export.
 The next step is to export the patch. PDE provides a convenient button in the top right section of the editor which will open the export dialog. Choose a directory where you want to export (you can move this folder to a website later to make it available remotely). You can also export to a jar file.
 On this wizard it is also very important to go to the options tab and turn on the "package as individual jar archives" and "generate metadata" options. These options are required for p2 to be able to understand and install the patch.
Hit the finish button, wait for the operation to complete and we're done!
To install the patch, we go to Help > Install New Software... Hit the Add Site button and select the directory we exported to (or the remote location, or the jar file). The dialog should now show our patch, check it and hit next to begin the install. You will have to step through a few pages to accept the license agreement.

After the install completes, we are prompted to restart eclipse (highly recommended). When Eclipse returns, we have a brand new feature to play around with.

So there you go, the basics of creating a feature patch!
Optional: Instead of exporting the patch directly, you can also use an update site project with a site.xml to deliver the patch. Simply open an existing site.xml or create a new site project (File > New... > PDE > Update Site Project), hit the add button, select your feature patch project, and build the site. Using a update site project will generate an html page as well as allow the pre-p2 update manager to access the site.
Delivering Feature Patches
One of the debug committers, Pawel Piech, has been working on creating a debug context breadcrumb. A cool feature that we are all looking forward too. The current patch applies nicely to the debug ui project, but there is a need to try out the feature in your main Eclipse environment. Self-hosting isn't practical for everyone. There are a couple of ways of doing this in 3.5:
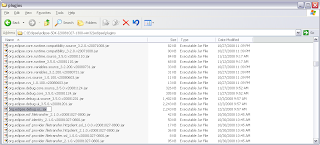
1) Hack them in :) Export the bundles, put them in your install directory, rename them to have the same name and version as the previously installed bundles and start with -clean. This will trick p2 into loading the new code and treating it the same as the previous bundles. This is not a great choice as you are working behind p2's back so if there are any problems, you are on your own.
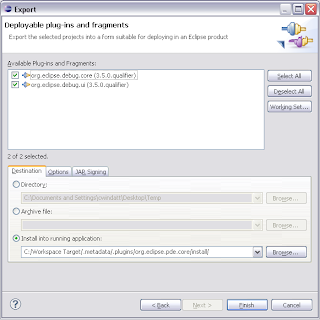
2) Use the new PDE one step export and install feature. Simply go to File > Export... > PDE > Deployable Plug-ins and Fragments. Then in the wizard, choose the last radio button "Install into running application". This will build your workspace bundles and use p2 to install them into your host application. Assuming all goes well, you'll have your code up and running and you can uninstall the changes using p2's UI (Help > Installation Information).
3) Create a feature patch. While option 2 is the fastest for developers, feature patches allow you to provide the changes via an update site. Users will be able to install without ever checking out any code from CVS. My next blog post will explain the basics of creating a feature patch.
1) Hack them in :) Export the bundles, put them in your install directory, rename them to have the same name and version as the previously installed bundles and start with -clean. This will trick p2 into loading the new code and treating it the same as the previous bundles. This is not a great choice as you are working behind p2's back so if there are any problems, you are on your own.

2) Use the new PDE one step export and install feature. Simply go to File > Export... > PDE > Deployable Plug-ins and Fragments. Then in the wizard, choose the last radio button "Install into running application". This will build your workspace bundles and use p2 to install them into your host application. Assuming all goes well, you'll have your code up and running and you can uninstall the changes using p2's UI (Help > Installation Information).

3) Create a feature patch. While option 2 is the fastest for developers, feature patches allow you to provide the changes via an update site. Users will be able to install without ever checking out any code from CVS. My next blog post will explain the basics of creating a feature patch.

Wednesday, September 24, 2008
The Debug Team Family Grows
As of 5:05 this morning, the Debug Team's family grew by one.
Congratulations Mike and Jen on your new baby boy!
Sean Robert Rennie
8.5 pounds, 21 inches
Congratulations Mike and Jen on your new baby boy!
Sean Robert Rennie
8.5 pounds, 21 inches
Thursday, July 10, 2008
Remember, hyperlink debugging rocks
While the feature has been around since 3.3, I still consider hyperlink debugging one of the most awesome features of the JDT debugger.
Hyperlink debugging lets you very quickly step into a selected method. Previously, to step into a method you would have to use step over to the line you wanted then step into, or click on the method you wanted and hit step into selection. With hyperlink debugging you simply hit ctrl (or ctrl-alt, I'll explain in a moment), and click where you want to go.

Starting with next week's integration build, the hyperlink debug feature will use ctrl as it's activator (previous versions used ctrl-alt). This change was made because we were the only hyperlink action to have an activator other than ctrl. If there are multiple hyperlink actions available, a handy popup will let you choose which to use.
For those who want to keep the old way of doing things, you can change the setting back to ctrl-alt on the General > Appearence > Editors > Text Editors >Hyperlinking Preference Page. Because I am often debugging a target platform, I often need quick access to both open type and step into selection hyperlinks, so I have switched my preference. If you think that ctrl-alt should be the default, leave a comment here.
Hyperlink debugging lets you very quickly step into a selected method. Previously, to step into a method you would have to use step over to the line you wanted then step into, or click on the method you wanted and hit step into selection. With hyperlink debugging you simply hit ctrl (or ctrl-alt, I'll explain in a moment), and click where you want to go.

Starting with next week's integration build, the hyperlink debug feature will use ctrl as it's activator (previous versions used ctrl-alt). This change was made because we were the only hyperlink action to have an activator other than ctrl. If there are multiple hyperlink actions available, a handy popup will let you choose which to use.
For those who want to keep the old way of doing things, you can change the setting back to ctrl-alt on the General > Appearence > Editors > Text Editors >Hyperlinking Preference Page. Because I am often debugging a target platform, I often need quick access to both open type and step into selection hyperlinks, so I have switched my preference. If you think that ctrl-alt should be the default, leave a comment here.
Subscribe to:
Posts (Atom)