Wednesday, December 06, 2006

Mixed-up Launching

I guess since it has been quite a while and we have made a pile more changes, it would be a good idea to maybe discuss some of it on "the blog".

The most notible additon to the debug platform as of late is mixed mode launching. With this new launching notion, we can perform things such as debugging and profiling at the same time....say what? The functionality to do so is an implementation delail that is not provided in the platform, but surely some on-the-ball client of the debug platform will provide it :) -- never-the-less the ability to have mixed mode launching still exists.....really it does....you can believe me....have I lied to you before?

Along with mixed-mode launching we have vastly improved contributing to launching in Eclipse:
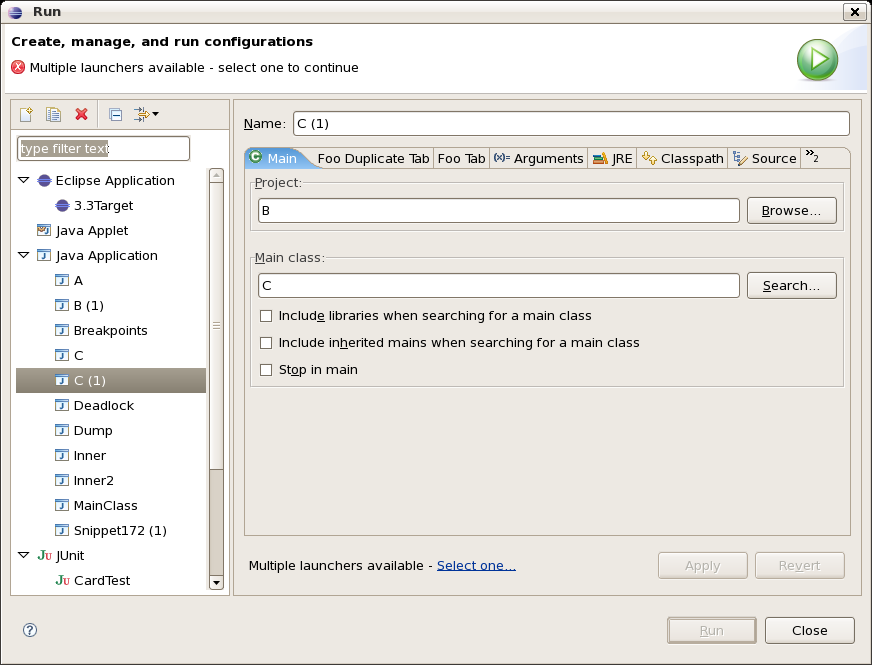
  1. To extend an existing tab group is now as simple as contributing your own tab...gone are the days of recreating the entire tab group to add one or more of your own tabs. You can even specify the location of your tab...oh my!
  2. Name and description fields have been added to the schemas for launch delegates
  3. Launch delegates (the code that actually launches stuff) can be retargetted dynamically during the launching process
  4. Duplicate launch delegate detection is now in place, with resolution mechanisms and a framework to set preferred delegates for both the workspace AND for individual launch configurations
So basicallly we have made a tonne of changes that 99% of normal users will never see, because it all appears to work the same on top. Making improvements noone ever sees or cares about rules.

There is some more information and a test plugin available from the debug team webpage
here: http://www.eclipse.org/eclipse/debug/documents.php.

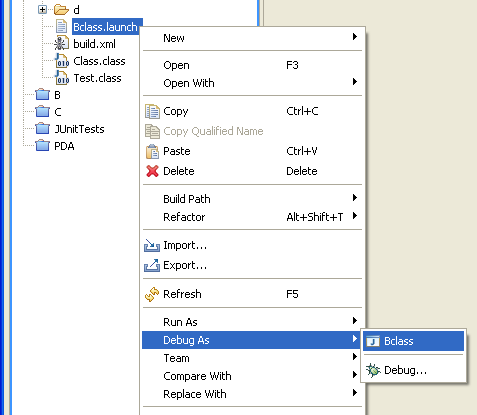
Oh and here is a screenshot showing the launch dialog opened with more that one launcher available and some contributed tabs added after the Main tab:

Monday, September 25, 2006

Terminate Key Binding Requests (please)

The platform is running low on available key-bindings. So, we've decided to add one final key-binding for the debugger's terminate action. The action has been mapped to "CTRL-F2". If you can figure out how to use the key binding preference page, feel free to change it.

We've also fixed a small bug in the Debug view context menu. Key-bindings are once again displayed for the standard step commands in the context menu (when you are debugging). During 3.2, the actions were all changed from view contributions to being contributed by actual code. When we did this, we forgot to assign action definition id's in the code. Woops. Fixed now.

Tuesday, September 19, 2006

Painfully Fast (Now)

Today the debug team revels in its own greatness...Ok we didn't actually fix anything, but we did find out that a bug that was a critical stop ship for us was not at all our fault AND someone had already fixed it (I love those ones).

The bug in question is https://bugs.eclipse.org/bugs/show_bug.cgi?id=153458, and long story short, has to do with the apparent 'extreme slow down' of the eclipse debuger. It turns out (as the previous comment dictates) that it was not our fault; it was really a combination of factors...but mainly the new conjestion algorithm in the newer Linux kernels (> 2.6.14). Luckily though the kernel champions jumped on it and bullied Sun into fixing the way jvms communicate over TCP/IP.

To summarize:
If you have a newer Linux kernel (> 2.6.14) and you are NOT using jdk 1.5.08 or jdk 1.6 r79 you are boned, and doomed to have a matrix-neo-style debugging experience.

Tuesday, August 29, 2006

A Whole Lotta' Instances

A first draft of another one of the new Java SE 1.6 features is out and ready to be played with. Much like the other feature (All References), All Instances works in pretty much the same way. You can right-click on a variable and select the All Instances... menu item, and before you know it WHAM, you see a popup showing you all of the instances of the selected object in the current VM. Isn't that dandy.

Much like it's companion All References, you of course need a Java SE 1.6 VM to use this feature, and you must be debugging at the time (i.e. have variables in the variables view). There are plans in the mix to expand its availabilty to the Outline View and to a context menu in the java editor....we shall see.

The first image below shows the location of the new action, and in this case we have selected a string, which will result in a popup showing all of the instances of type String in the current VM.


This next image shows the resulting popup (yes it is the inspect popup) telling us that there are 769 instances of String in the current VM. Allow me to say again, dandy.


To try out this...dare I say again...dandy new feature, you will have to wait until the next build or grab the source from HEAD.

Wednesday, August 09, 2006

Browse All References (J2SE 6 only)

If you're running your Java application with a J2SE 6 virtual machine, you can browse all references to an object in the variables view. Select any object in the variables view, and choose All References from the context menu. A pop-up displays all objects referring to the selected object. You can expand each node in the tree to follow references to each object. You can inspect any object in the reference tree by selecting it and pressing Ctrl+Shift+I. This opens an inspect pop-up displaying the object's fields.

This feature is available in the latest integration build and forthcoming 3.3M1 build. It's our first cut of the feature, so feedback and comments are welcome.

Wednesday, August 02, 2006

Let the pain slip away

Seeing as how I seem to be in such a blog-tastic mood....the debug team has provided another fix to try and lower the overall frustration of level of at least a few people.

Have you ever been nailed by the "java.lang.UnsupportedClassVersionError: foo (Unsupported major.minor version 49.0)" error? If you have this applies to you.

In an effort to make life a little less painful, we now do compliance checking in the JRE preference page and in the launch configuration dialog. So if you change your default JRE to be lower than the compiler compliance level you get a nice warning and a link back to the compiler page to change the compliance level.


Alternatively in the launch configuration dialog compliance issues are treated as errors (since you can't launch anyway) and you see the nice angry error message.

Just like the previous breakpoint axesomeness, you will have to wait until tomorrows build to try it out...

Breakpoints are Axesome

Everyone loves breakpoints. Why else would you debug if you did not want to use breakpoints?
That being said, this last week we refactored alot of our breakpoints code to make it better all around and to add some new features.

For example:
  1. If you use the shortcut Ctrl+Shift+B, you will get the correct kind of breakpoint (instead of just a line breakpoint)
  2. Added new Run menu item "Toggle Breakpoint" which is now bound to the Ctrl+Shift+B shortcut (which also retargets the command to create the proper breakpoint, see point 1 above)
  3. You can toggle Class Load breakpoints like other breakpoints (using the shortcut, double clicking on the ruler, or using the Run->Toggle Breakpoint menu)
  4. That slight flicker in the breakpoints view when you create method breakpoints or watchpoints is gone.
  5. Improved menu population/enablement for toggle breakpoints actions in the Run menu, Outline View and the Variables View.
Here is a screen shot of the new Run menu item.


All this breakpoints goodness will be available after tomorrows build...

Monday, June 26, 2006

What can your VM do for you?

This week is busy like all the rest. Following the trend of adding in new features all the time, here is another interesting one for you. You can now check the capabilities of the VM used to launch a program by inspecting the properties of any Java debug element in the Debug View (to do so right-click on the element in the view and click the 'Properties...' menu item).

The properties dialog is the same one as before, which contains the process information, but now also the VM capabilities (as long as the target is not terminated or disconnected). You can even expand or collapse items on the page depending on what you want to see, and the page will remember that setting for the next time you open the dialog to view capabilities.


So if you were always wondering "hmm can my VM do that?" now you can check for yourself. To use this latest feature you will need to wait for this weeks I-build, or for tomorrows N-build.

Can I launch my launch from the launch shortcut?

Last week was very busy for the Debug team. Along with the addition of the new formatting feature for Stack Trace Console, we also added a new feature which allows users to directly run a shared launch configuration using the context Run As... menu and selecting the launch itself.

No more fussing with the launch configuration dialog to run shared configurations (unless you like needless work) YAY.


You will have to wait until this weeks I-build, or grab an N-build from any time after last thursday to check it out.

Wednesday, June 21, 2006

Kevin's formatting magic

We added a new feature to the Java Stack Trace Console this week. It will now format your stack traces for you automatically when ever you paste them into the console if you desire. You'll have to download this weeks Integration build to try it out.